Zentyal Server 3.5
|
Getting Started
If manual configuration is necessary, or if a service consists of multiple processes, the subgroups will show up once you click on the module icon. Under Firewall , for example, the groups packet filtering, port forwarding, and SNAT are available. Because the firewall requires a different configuration depending on the application scenario, users are advised to review the existing filter and provide additional rules if necessary.
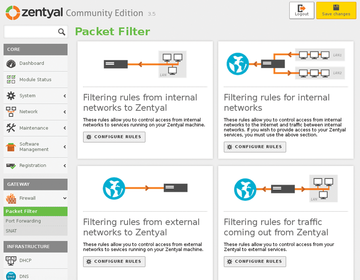
After clicking on the Packet Filter sub-group, Zentyal displays four possible ways to regulate the traffic in clear diagrams in the right-hand pane of the browser (Figure 4).
 Figure 4: The built-in firewall does not present beginners with insurmountable hurdles during the configuration.
By clicking on Set Rules under each group, you can begin to adjust package rules of each group. The default settings set an a minimum filter system, because they do not contain detailed filters. Zentyal inserts the newly defined filter rules into a table that is similar to iptables. However, Zentyal's version is much easier to understand. Basic knowledge of the operation of firewalls and detailed knowledge of iptables will be useful here.
To add a new rule, just click Add New Rule under the table view. Click on all of the desired rules in the drop-down menus. In the only free input field labeled Description, you can store a reference to the new filter rules. Finally, users can apply the new rule by clicking Add . Once this is done, the new rule then appears in the table.
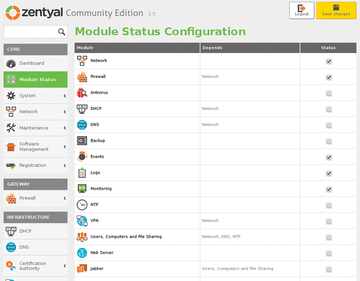
To manage the status of various services, go to the core group at the top left and click on Module Status . Zentyal will open a list of available modules in the right pane view, each with a checkbox in the last column labeled Status .
Users can enable modules by ticking the box next to the desired service. If a service is dependent upon another module, you will be notified that this module will also be set up by the software in a separate message. To apply the changes, click on the yellow Save Changes button in the top right of the window (see Figure 5).
 Figure 5: You determine which services you wish to activate in the status module with the click of a mouse.
Monitoring
Monitoring and log files can be useful when problems arise, especially in larger networks or when many services are active. Zentyal offers two options: the activated monitoring module provides you with near real-time graphical representations using the "hard" data from your computer system, while the log services module monitors each individual active server module.
Log services and monitoring are available as separate modules via the component selection. After one reboot, users will find a Maintenance module in a core list on the left. The options Monitoring and Logs are under that. You can open available log files for different services in the right-hand pane. Click on the Service button, which is marked with a gear, in the column marked Full Report . Zentyal now branches out in a window with various parameters. The full view of each log file can be accessed by clicking on Display .
To filter the services to display, users can specify different criteria in the area labeled Custom Query . This seems especially useful for very large log files that can be confusing in the overall view. After adjusting the display settings, click on the Search button, whereupon the software of a modified report is displayed.
The group labeled Monitoring shows a graphical representation of information about the hardware within your system. It updates almost in real time and shows the usage of key system components. Users can filter the graphic display by selecting one of the buttons at the top of the window.
The section Hard Disk Monitoring , under Maintenance , shows users the availability of space on their mass storage in a pie chart. If users have multiple partitions, they can change the view by activating the desired partition in the device specifications area.
« Previous 1 2 3 Next »
Buy this article as PDF
Pages: 4
(incl. VAT)


